Problem
The probability distribution of the discrete random variable X is given in the table:
|
xi
|
27
|
77
|
85
|
91
|
98
|
|
pi
|
0.2
|
0.4
|
0.1
|
0.2
|
0.1
|
Find:
-
The expected value M(X)
-
The variance D(X)
-
The standard deviation σ(X)
-
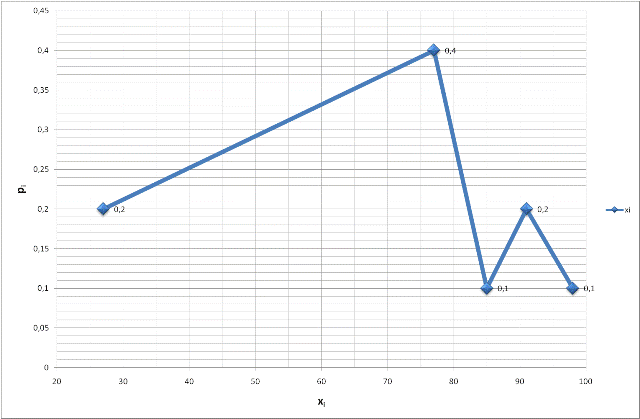
Construct the probability distribution polygon.
Solution
1. Expected Value M(X)
The expected value M(X) is the sum of the products of xi and pi:
M(X) = ∑xipi = 27⋅0.2 + 77⋅0.4 + 85⋅0.1 + 91⋅0.2 + 98⋅0.1 = 72.7
2. Variance D(X)
To determine the variance, we first construct the table of squared deviations from the expected value [xi−M(X)]2.
For x1, the value [xi−M(X)]2 = (27−72.7)2 = 2088.49. The other values are given in the table:
|
[xi - M(X)]2
|
2088.49
|
18.49
|
151.29
|
334.89
|
640.09
|
|
pi
|
0.2
|
0.4
|
0.1
|
0.2
|
0.1
|
Now, we determine the variance D(X) as the sum of the products [xi−M(X)]2pi:
D(X) = ∑i[xi−M(X)]2pi = 2088.49⋅0.2 + 18.49⋅0.4 + 151.29⋅0.1 + 334.89⋅0.2 + 640.09⋅0.1 = 571.21
3. Standard Deviation σ(X)
The standard deviation σ(X) is the square root of the variance:
σ(X) = D(X) = 571.21 = 23.9
4. Probability Distribution Polygon
To construct the probability distribution polygon, plot the points (xi,pi) on a graph and connect them with straight lines. Here are the points:
-
(27, 0.2)
-
(77, 0.4)
-
(85, 0.1)
-
(91, 0.2)
-
(98, 0.1)
This polygon visually represents the probability distribution of the discrete random variable X.

Discrete Random Variables |
Описание курса
| Mathematical statistics
|

