- Demand
Demand is the quantity of a good or service that consumers are willing to buy at a specific price over a certain period. Several factors influence the level
of demand, such as the price of the good, consumer incomes, tastes and preferences, prices of substitute and complementary goods, expectations
of future prices, and the level of advertising activity. Demand can be divided into two types: effective (real demand, backed by purchasing power)
and potential (the desire of consumers to buy the good when their incomes increase).
- Supply
Supply is the quantity of a good or service that producers are willing to offer in the market at a specific price over a certain period. Supply is influenced
by factors such as production costs, level of technology, number of producers, government policy (taxes, subsidies, regulation), prices of resources,
and market competition conditions.
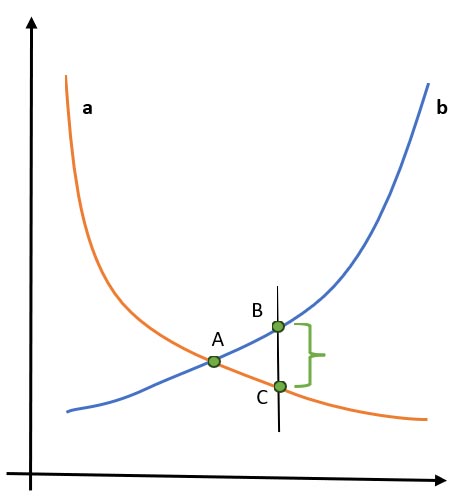
- Demand and Supply Graph

A demand and supply graph visually represents the relationship between demand and supply at different prices.
- Graph Axes: The horizontal axis (X) represents the quantity of the good, while the vertical axis (Y) represents the price.
- Demand Curve (a): Typically has a downward slope, reflecting the inverse relationship between price and quantity demanded: as price increases,
demand decreases; as price decreases, demand increases.
- Supply Curve (b): Typically has an upward slope, reflecting the direct relationship between price and quantity supplied: as price increases, producers
are willing to offer more goods.
- Equilibrium Point (A): The intersection of the demand and supply curves indicates market equilibrium, where the quantity of the good supplied
matches the quantity demanded.
-
Behavior of Demand and Supply Curves. Concept of Elasticity
Elasticity of demand and supply shows how much the quantity demanded or supplied changes with a change in price. High elasticity means a small price change
leads to a significant change in quantity. Low elasticity indicates a weak reaction of consumers or producers to price changes.

